SDSS Standard Star catalog
This demonstrates how to fetch and plot the colors of the SDSS Stripe 82 standard stars, both alone and with the cross-matched 2MASS colors.
# Author: Jake VanderPlas <vanderplas@astro.washington.edu>
# License: BSD
# The figure is an example from astroML: see http://astroML.github.com
import numpy as np
from matplotlib import pyplot as plt
from astroML.datasets import fetch_sdss_S82standards
from astroML.plotting import MultiAxes
#------------------------------------------------------------
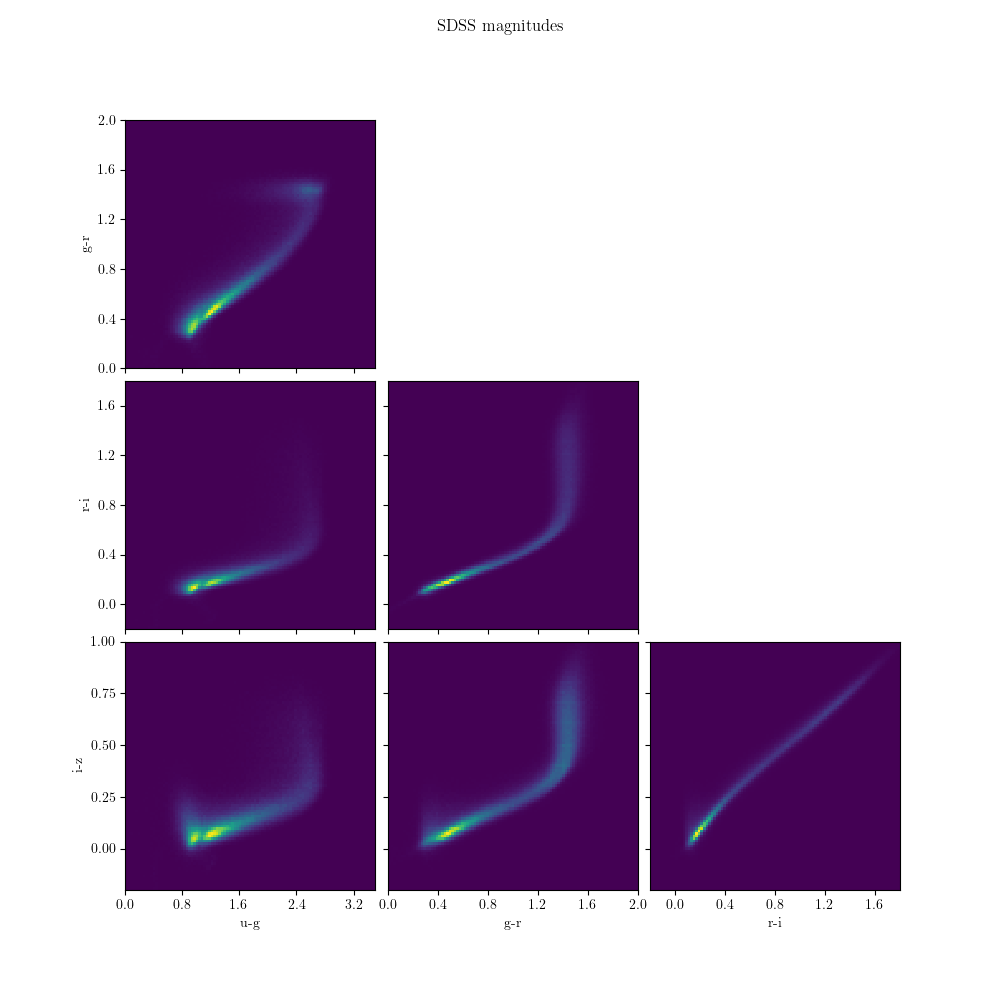
# Plot SDSS data alone
data = fetch_sdss_S82standards()
colors = np.zeros((len(data), 4))
colors[:, 0] = data['mmu_u'] - data['mmu_g']
colors[:, 1] = data['mmu_g'] - data['mmu_r']
colors[:, 2] = data['mmu_r'] - data['mmu_i']
colors[:, 3] = data['mmu_i'] - data['mmu_z']
labels = ['u-g', 'g-r', 'r-i', 'i-z']
bins = [np.linspace(0.0, 3.5, 100),
np.linspace(0, 2, 100),
np.linspace(-0.2, 1.8, 100),
np.linspace(-0.2, 1.0, 100)]
fig = plt.figure(figsize=(10, 10))
ax = MultiAxes(4, hspace=0.05, wspace=0.05, fig=fig)
ax.density(colors, bins=bins)
ax.set_labels(labels)
ax.set_locators(plt.MaxNLocator(5))
plt.suptitle('SDSS magnitudes')
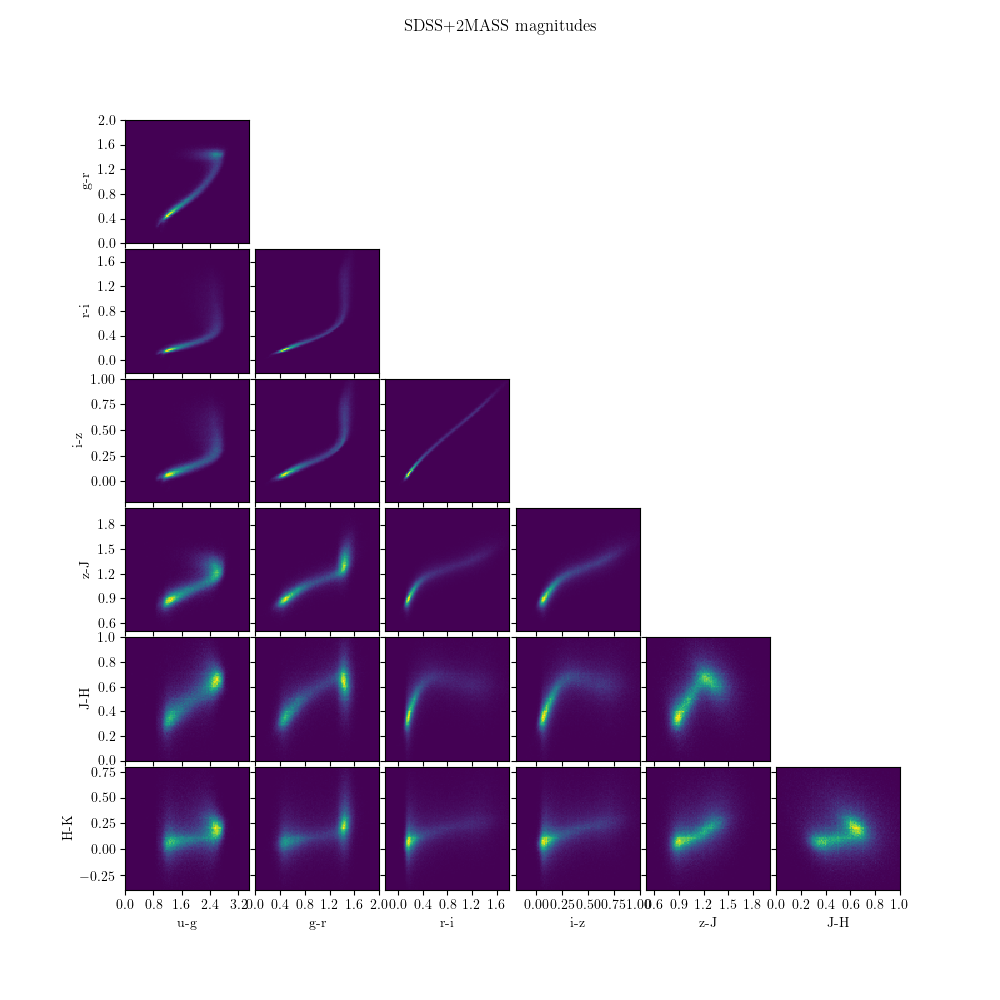
#------------------------------------------------------------
# Plot datacross-matched with 2MASS
data = fetch_sdss_S82standards(crossmatch_2mass=True)
colors = np.zeros((len(data), 7))
colors[:, 0] = data['mmu_u'] - data['mmu_g']
colors[:, 1] = data['mmu_g'] - data['mmu_r']
colors[:, 2] = data['mmu_r'] - data['mmu_i']
colors[:, 3] = data['mmu_i'] - data['mmu_z']
colors[:, 4] = data['mmu_z'] - data['J']
colors[:, 5] = data['J'] - data['H']
colors[:, 6] = data['H'] - data['K']
labels = ['u-g', 'g-r', 'r-i', 'i-z', 'z-J', 'J-H', 'H-K']
bins = [np.linspace(0.0, 3.5, 100),
np.linspace(0, 2, 100),
np.linspace(-0.2, 1.8, 100),
np.linspace(-0.2, 1.0, 100),
np.linspace(0.5, 2.0, 100),
np.linspace(0.0, 1.0, 100),
np.linspace(-0.4, 0.8, 100)]
fig = plt.figure(figsize=(10, 10))
ax = MultiAxes(7, hspace=0.05, wspace=0.05, fig=fig)
ax.density(colors, bins=bins)
ax.set_labels(labels)
ax.set_locators(plt.MaxNLocator(5))
fig.suptitle('SDSS+2MASS magnitudes')
plt.show()