SDSS Imaging
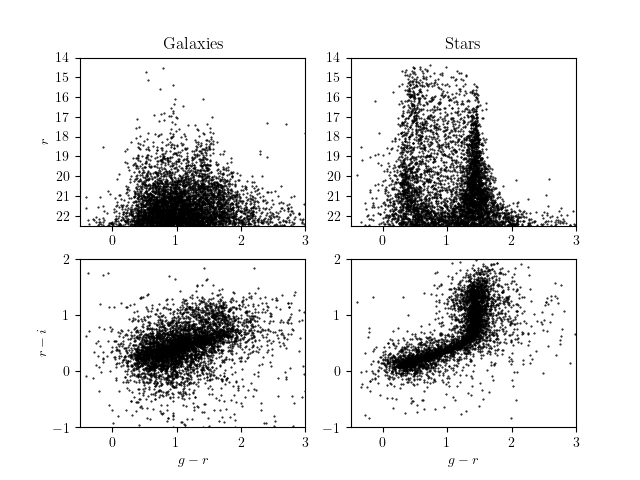
This example shows how to load the magnitude data from the SDSS imaging catalog, and plot colors and magnitudes of the stars and galaxies.

# Author: Jake VanderPlas <vanderplas@astro.washington.edu>
# License: BSD
#   The figure is an example from astroML: see http://astroML.github.com
import numpy as np
from matplotlib import pyplot as plt
from astroML.datasets import fetch_imaging_sample

#------------------------------------------------------------
# Get the star/galaxy data
data = fetch_imaging_sample()

objtype = data['type']

stars = data[objtype == 6][:5000]
galaxies = data[objtype == 3][:5000]

#------------------------------------------------------------
# Plot the stars and galaxies
plot_kwargs = dict(color='k', linestyle='none', marker='.', markersize=1)

fig = plt.figure()

ax1 = fig.add_subplot(221)
ax1.plot(galaxies['gRaw'] - galaxies['rRaw'],
         galaxies['rRaw'],
         **plot_kwargs)

ax2 = fig.add_subplot(223, sharex=ax1)
ax2.plot(galaxies['gRaw'] - galaxies['rRaw'],
         galaxies['rRaw'] - galaxies['iRaw'],
         **plot_kwargs)

ax3 = fig.add_subplot(222, sharey=ax1)
ax3.plot(stars['gRaw'] - stars['rRaw'],
         stars['rRaw'],
         **plot_kwargs)

ax4 = fig.add_subplot(224, sharex=ax3, sharey=ax2)
ax4.plot(stars['gRaw'] - stars['rRaw'],
         stars['rRaw'] - stars['iRaw'],
         **plot_kwargs)

# set labels and titles
ax1.set_ylabel('$r$')
ax2.set_ylabel('$r-i$')
ax2.set_xlabel('$g-r$')
ax4.set_xlabel('$g-r$')
ax1.set_title('Galaxies')
ax3.set_title('Stars')

# set axis limits
ax2.set_xlim(-0.5, 3)
ax3.set_ylim(22.5, 14)
ax4.set_xlim(-0.5, 3)
ax4.set_ylim(-1, 2)

# adjust tick spacings on all axes
for ax in (ax1, ax2, ax3, ax4):
    ax.xaxis.set_major_locator(plt.MultipleLocator(1))
    ax.yaxis.set_major_locator(plt.MultipleLocator(1))

plt.show()
